
How to open the developer console window
As the weather warms and the days grow longer, nature comes alive with blooming flowers and leafy trees, ushering in a new Spring season of fresh beginnings and rejuvenation. This renewed energy in the air often prompts people to search for long-forgotten skills or seek a refresher on certain topics. With that in mind, we’re excited to present another installment of our Salesforce “How to” ABCs! The series where we tackle the most commonly Googled Salesforce questions, letter by letter, to help trailblazers find the answers they’re looking for fast!
Today’s letter is “O” as in, “How to open the developer console window”. Let’s dive in!
A developer console window is a versatile tool for executing code, testing customizations, and debugging issues in Salesforce. It enables developers to filter logs, view executions, identify performance issues, and edit metadata components like classes, triggers, and pages. Additionally, developers can write and execute Apex code, JavaScript, SOQL queries, and, more.
To access the Developer Console, you must first log in to your Salesforce org and navigate to the Setup menu. You can do this by clicking on the gear icon in the upper-right corner of the page.
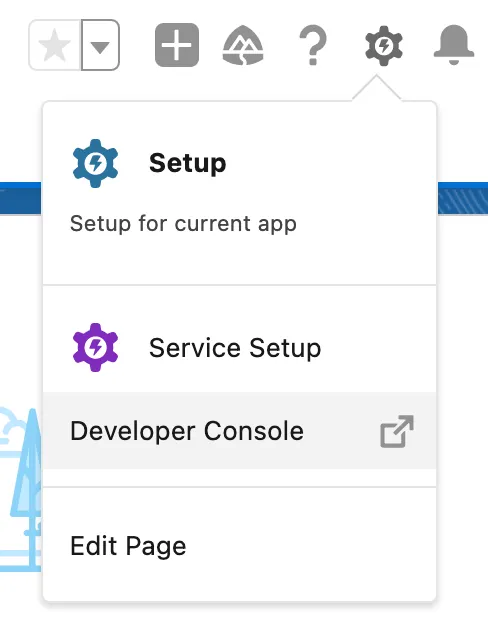
Within the Setup dropdown, you will see Developer Console, click on this to open up the Dev window.
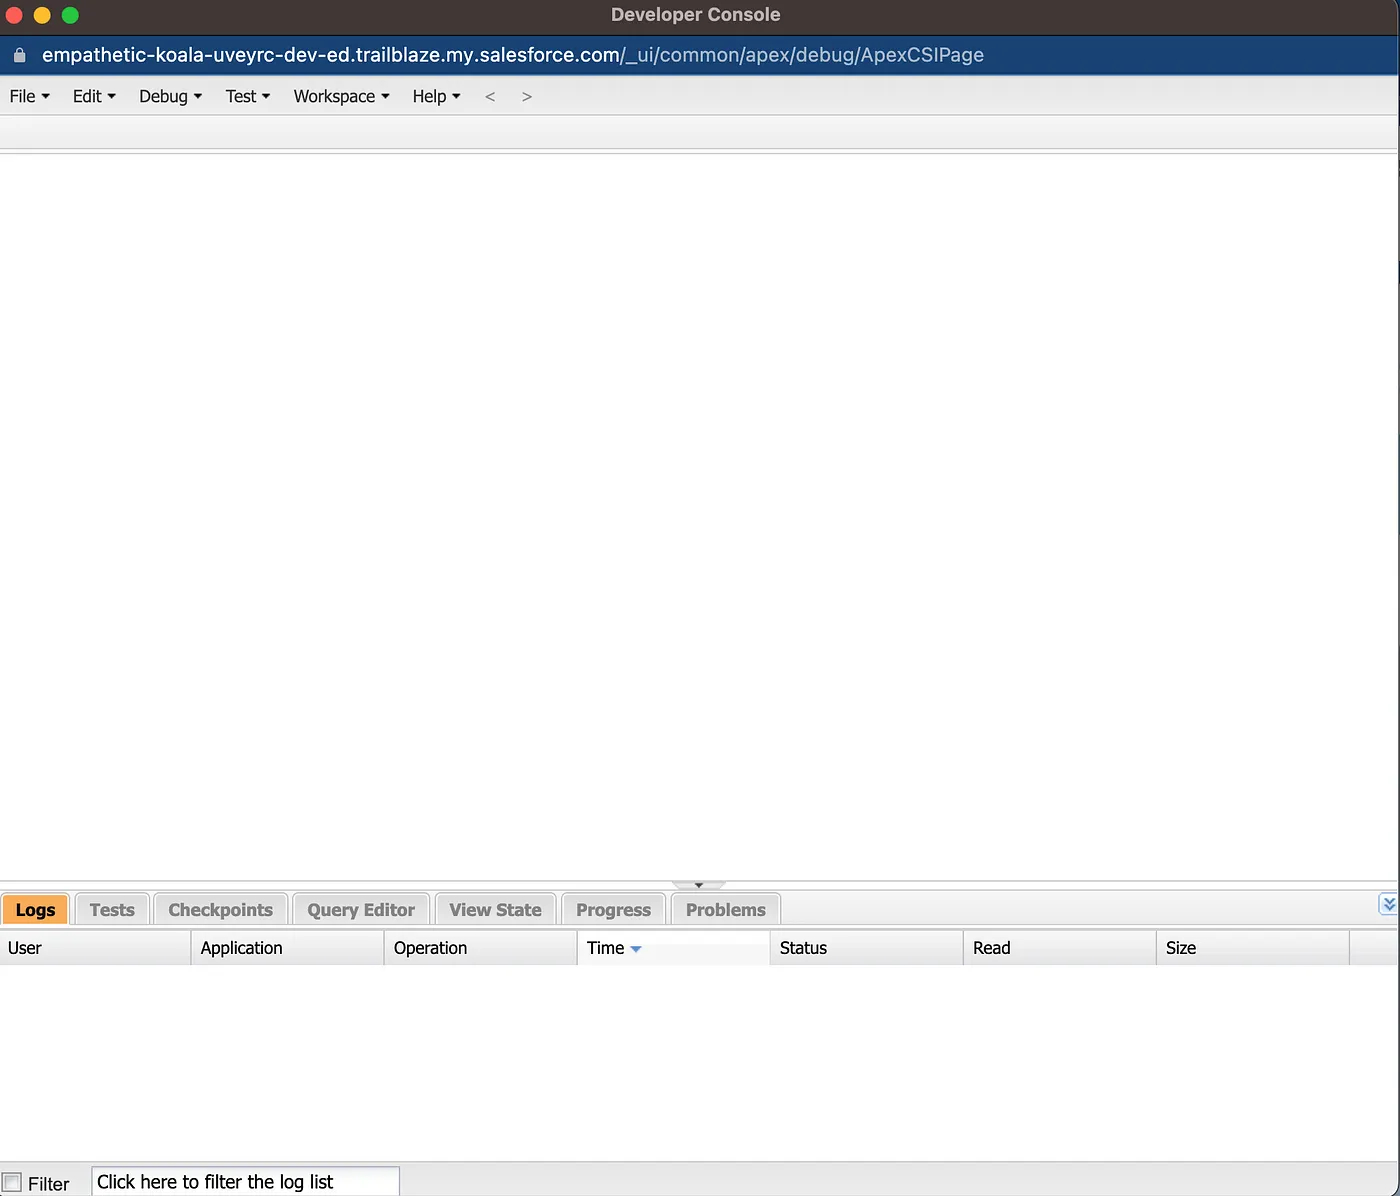
Once the Developer Console is open, you can use its navigation to edit, debug, test, and build up workspaces.
Developers can boost their efficiency, enhance code quality, and provide superior solutions to clients by utilizing a range of tools, such as navigating or editing code, analyzing logs, inspecting objects, building checkpoints, or executing SQL queries. If you need a hand getting started, consider exploring the Developer Console Basics module or drop us a line! We’re always happy to help.
As always, will see you in the cloud.